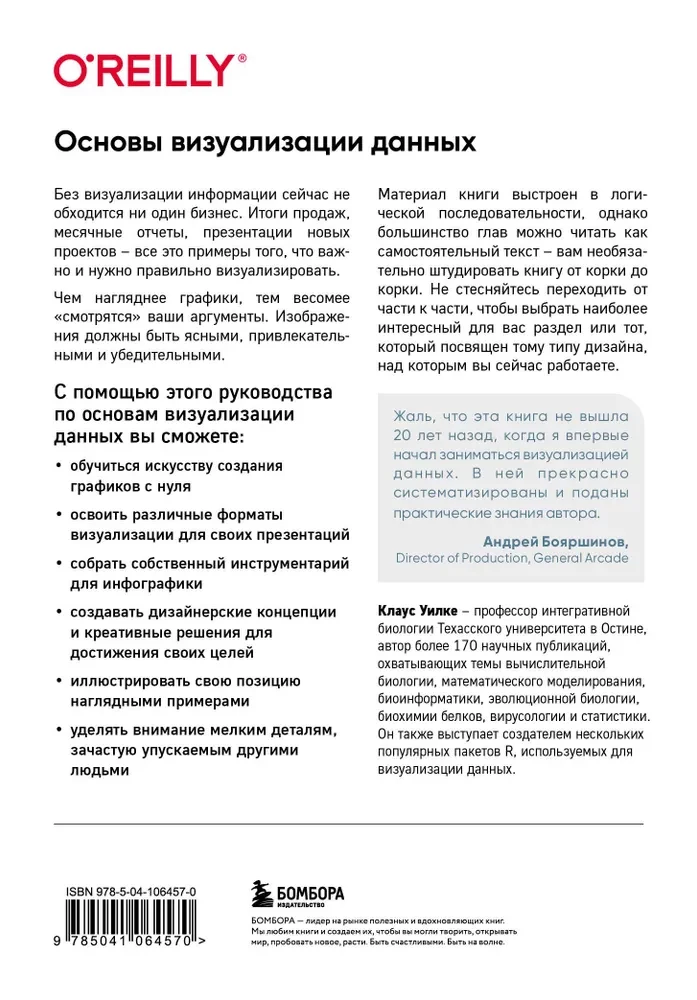
Basics of Data Visualization. A Guide to Effective and Persuasive Information Presentation
No business can do without information visualization nowadays. Sales results, monthly reports, presentations of new projects – all these are examples of what is important and necessary to visualize properly.
The clearer the graphs, the more weighty your arguments appear. Images...
should be clear, attractive, and convincing.
With the help of this guide to the basics of data visualization, you will be able to:
• learn the art of creating graphs from scratch;
• master various formats of visualization for your presentations;
• assemble your own toolkit for building…
• create design concepts and creative solutions to achieve your goals;
• illustrate your position with clear examples;
• pay attention to the small details often overlooked by others.
The material in the book is structured in a logical sequence; however, most chapters can be read as standalone texts – you are not required to study the book cover to cover. Feel free to jump from part to part to select the section that interests you the most or the one that is dedicated to the type of design you are currently working on.
Klaus Wilke – Professor of Integrative Biology at the University of Texas at Austin, author of more than 170 scientific publications covering topics in computational biology, mathematical modeling, bioinformatics, evolutionary biology, protein biochemistry, virology, and statistics. He is also the creator of several popular R packages used for data visualization.
Author: Клаус Уилке
Printhouse: Eksmo
Series: Library of Digital Transformation
Age restrictions: 12+
Year of publication: 2024
ISBN: 9785041064570
Number of pages: 352
Size: 243x170x24 mm
Cover type: hard
Weight: 710 g
ID: 1647818
16 January (Fr)
free
15 January (Th)
€ 9.99
free from € 80.00
16 January (Fr)
free
15 January (Th)
€ 9.99
free from € 80.00
-
MNOGOKNIG Gmbh, Frederichstrasse 176-179, Berlin, Germany, 10117+4915205421866


