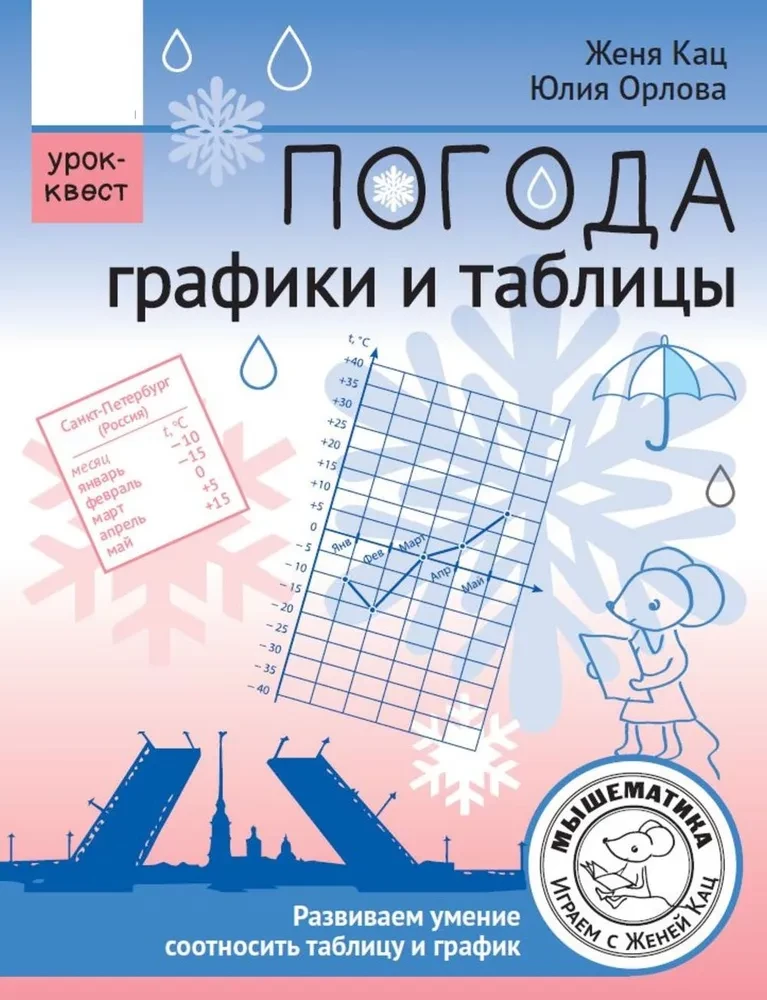
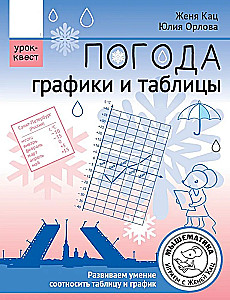
Weather. Charts and Tables. Educational Quest
The notebook contains materials for the quest - tables and graphs of the weather, text tasks, templates for independently creating tasks.
Who is this quest for? The quest introduces students in grades 2-4 to the form of information presentation in the... form of graphs and tables.
What skills do such tasks develop? The ability to read graphs, the ability to relate a graph and a table about the same city.
Where can these tasks be applied? In lessons of mathematics or the surrounding world in grades 2-6.
What is the difference from other mathematics tasks? All tasks require personal involvement from students. Some look for their city, some look for the city where their friends, grandparents, or a city they visited live. The teacher can ask students in advance which cities they visited during the summer, where their parents or grandparents are from, and add 4-8 cities by describing the weather for them in the form of a table and a graph.
What are the advantages? Many children nowadays rarely look at the thermometer and do not have experience keeping their own weather calendar. Therefore, they do not encounter graphs themselves and poorly understand information presented in this form.
Author: Евгения Кац
Printhouse: MTsNMO
Age restrictions: 0+
Year of publication: 2023
ISBN: 9785443943916
Number of pages: 32
Size: 300x210x2 mm
Cover type: soft
Weight: 80 g
ID: 1695730
In stock
€ 3.79
Will be delivered to United States on 9 July (Th):
By courier
from € 38.94