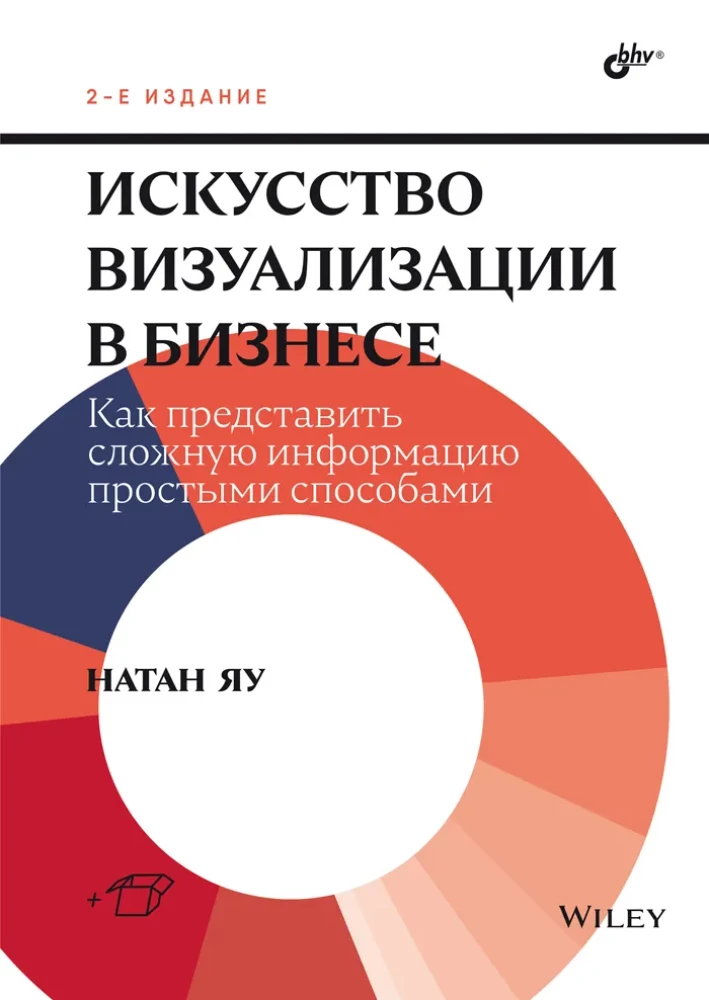
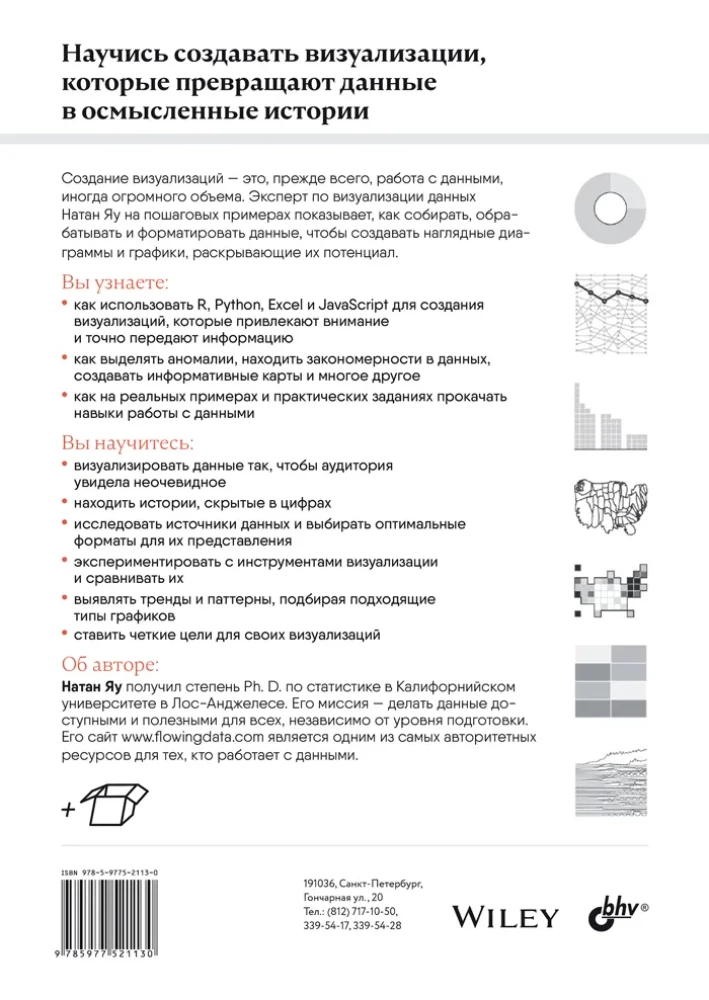
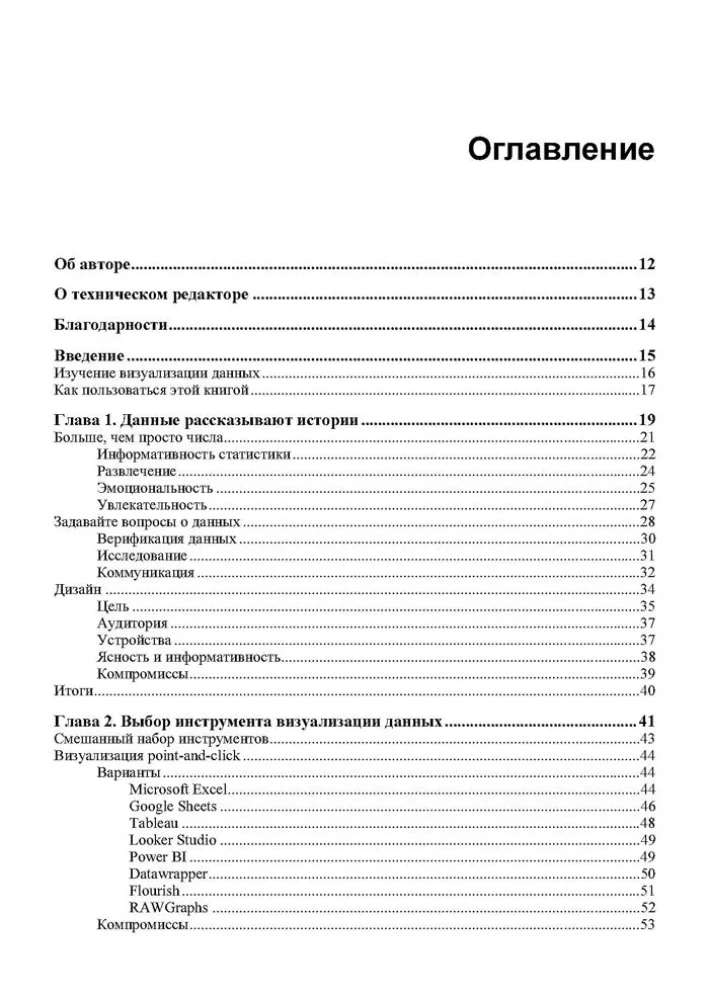
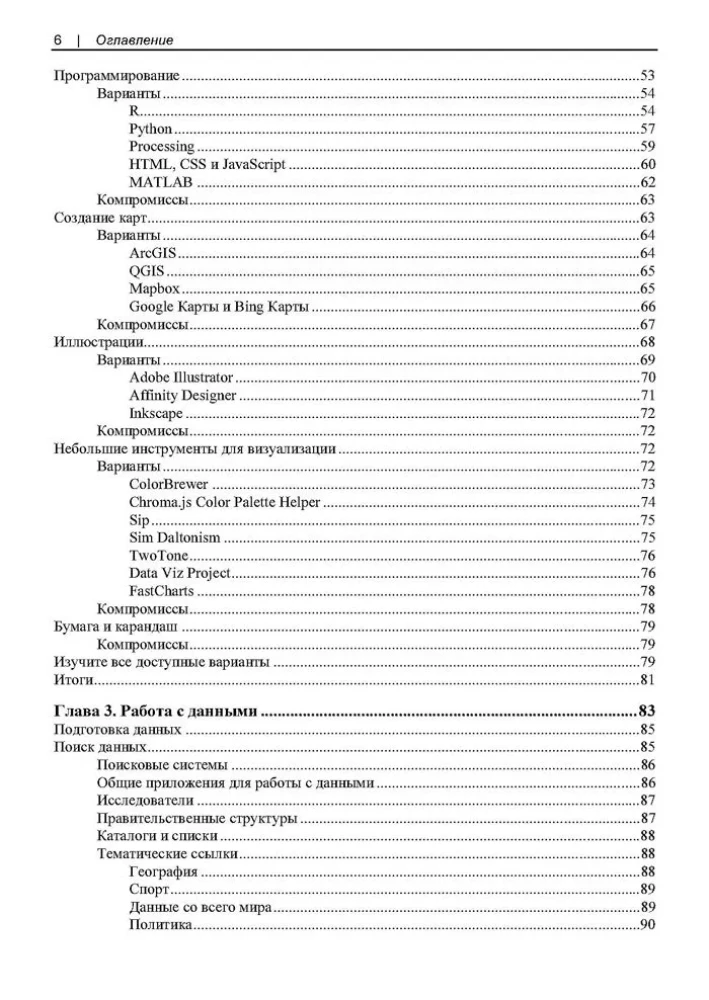
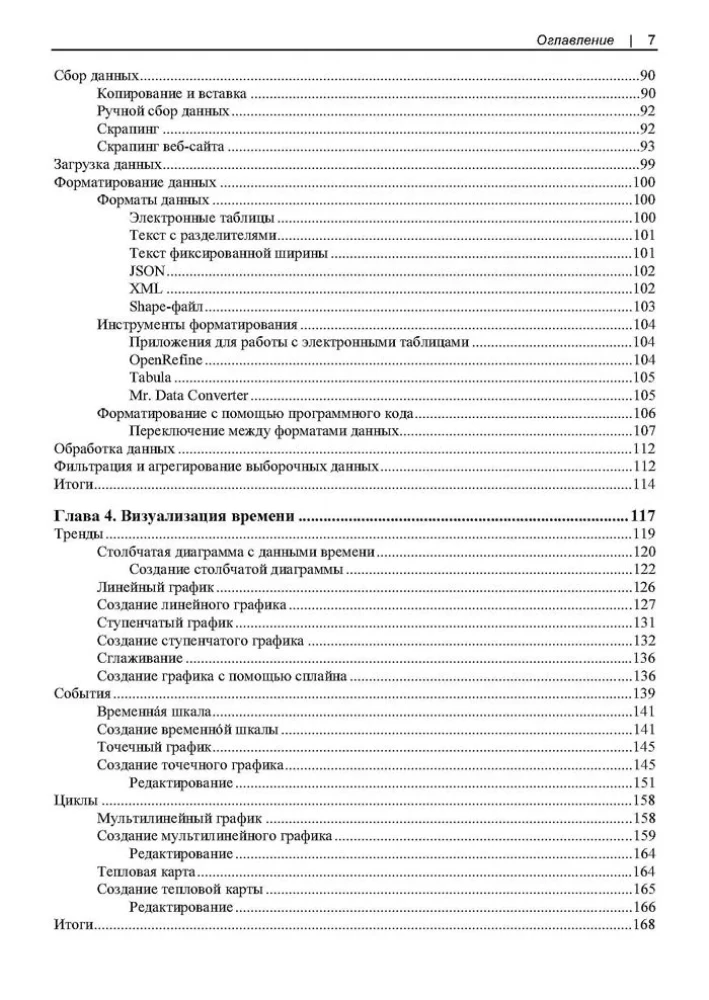
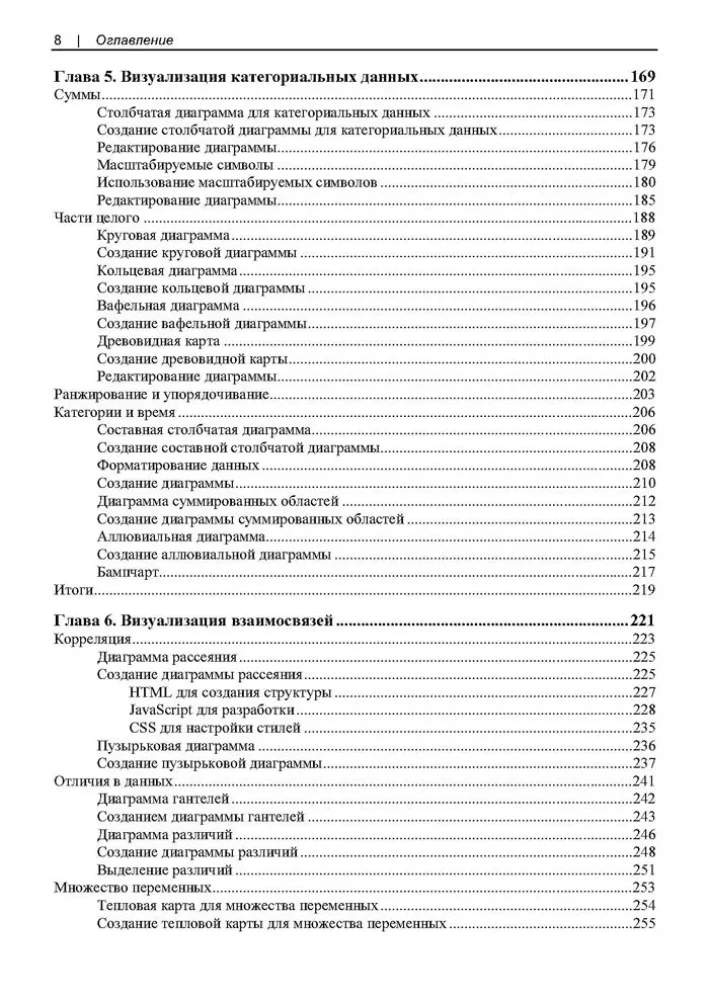
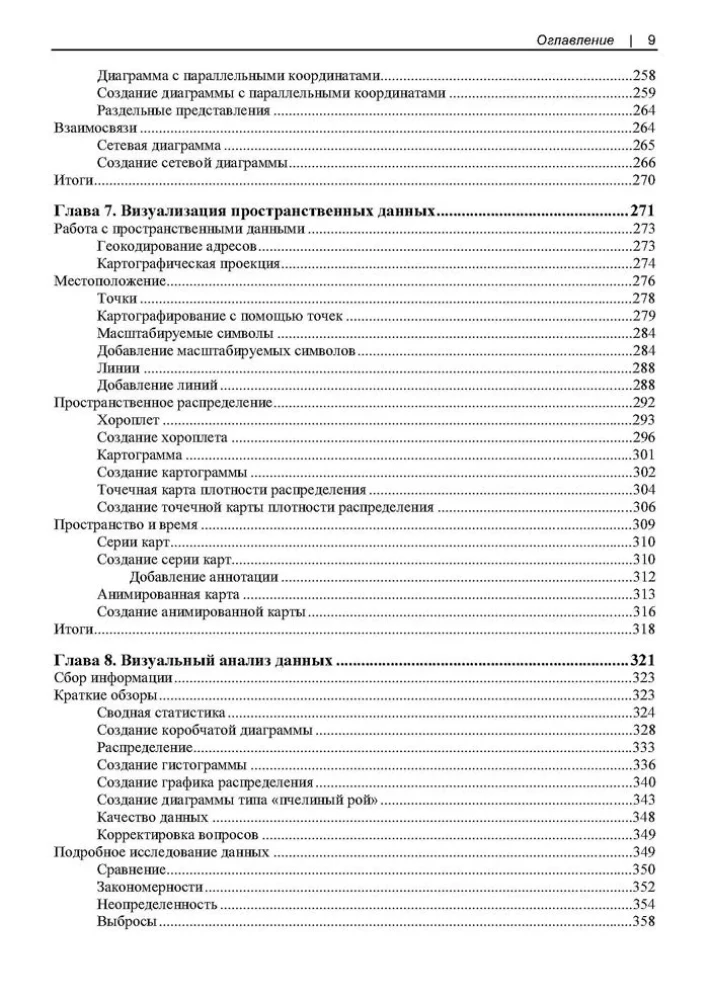
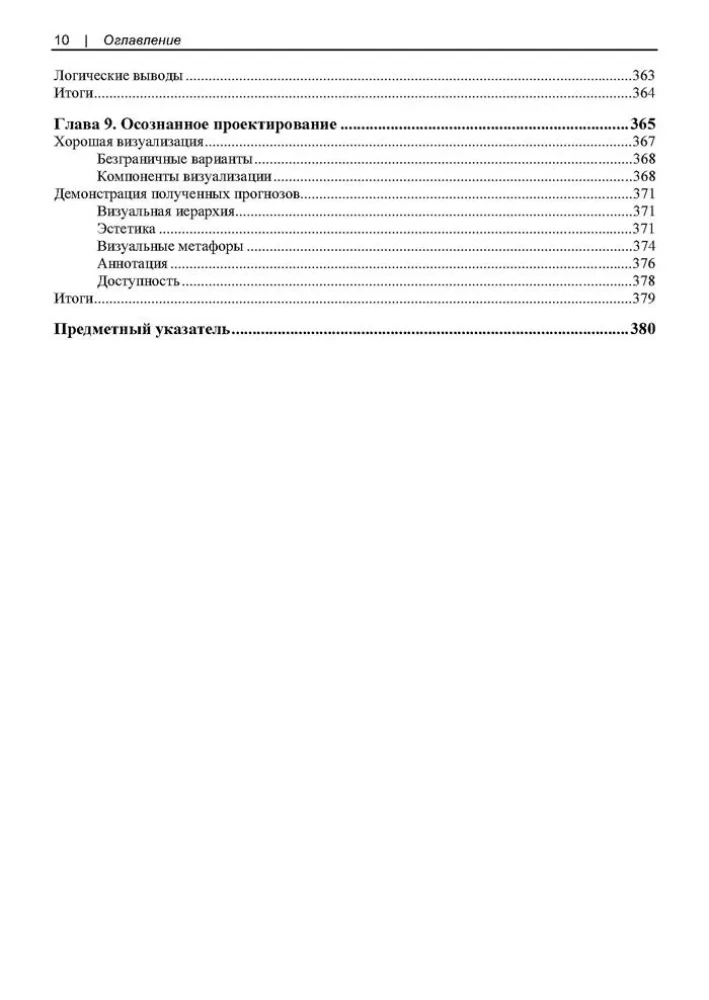

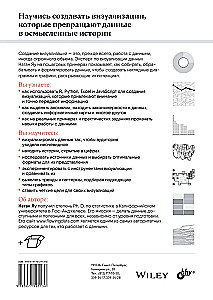
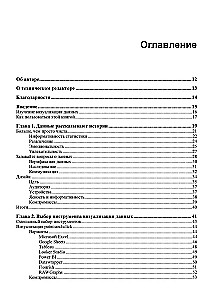
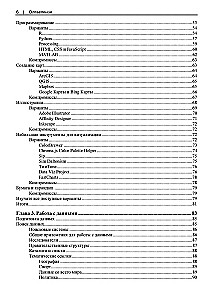
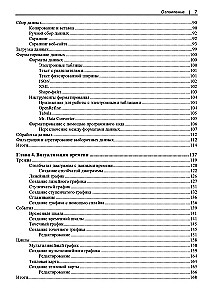
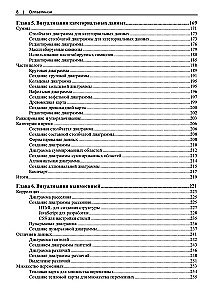
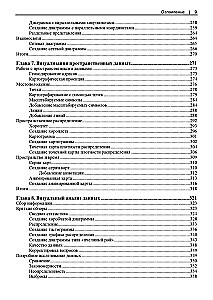
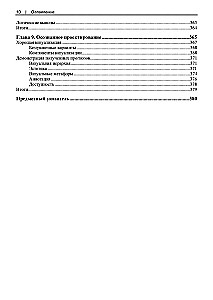

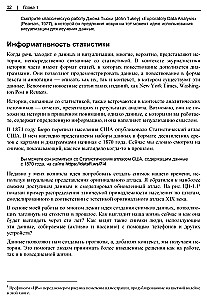
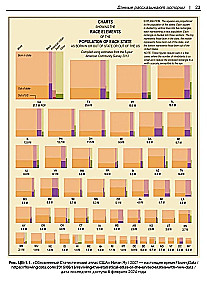
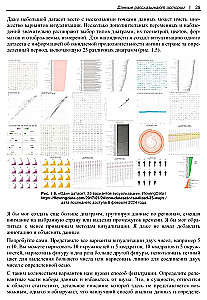
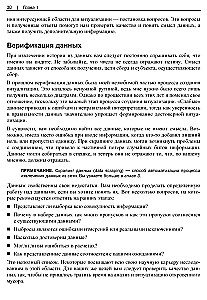

This practical guide to transforming data into understandable and persuasive visual stories covers key aspects of working with information: from formulating questions for data to selecting tools and methods for visualization. It demonstrates how to process data, highlight trends, compare categories, and analyze relationships. Separate chapters are dedicated to the visualization of time, space, and multidimensional data.
The second edition includes new chapters on data analysis and interactive graphics, modern examples of visualizations have been added, the code and tools have been completely revised using R, Python, and JavaScript, with an emphasis on meaningful and effective visualizations focusing on clarity and purpose.
Sold out
€ 28.09
Sold out
€ 28.09
Bestsellers






€ 11.59
In stock
We Are Right for Each Other: How Attachment Theory Can Help Create Harmonious Relationships
Амир Левин, Рэйчел Хеллер






€ 11.99
In stock
Invisible Women: Why We Live in a World Designed for Men. Data Bias in a World Designed for Men
Кэролайн Криадо Перес



€ 6.99
In stock
How to Talk So Kids Will Listen, and How to Listen So Kids Will Talk
Элейн Мазлиш, Адель Фабер